Lately, I’ve been low-key obessed with SemiAnalysis articles, and one in particular made me pause:
even 8x H100 cannot serve a 1 trillion parameter dense model at 33.33 tokens per second. Furthermore, the FLOPS utilization rate of the 8xH100’s at 20 tokens per second would still be under 5%, resulting is horribly high inference costs.
While the claim is from 2023 and inference is still largely memory-bandwidth-bound, the hardware game has evovled since then. Newer GPUs like NVIDIA H200s, B200s and GB300 have dramatically raised the capabilities and ultra-scale inference platforms (think Blackwell Ultra and Cerebas) now support dense models well over trillion params at user-serving latencies of ~1000 toks/s.
But what really caught my eye was the under utilized rate of these modern GPUs. Around the same time, I briefly read How to Scale Your Model, which emphasized:
We strongly believe it’s worth understanding every piece of the Transformer architecture: the exact sizes of every matrix, where normalization occurs, how many parameters and FLOPs are in each part.
This prompted me to question how I’ve been thinking about FLOPs and learn beyond the obvious definition I understand it with!
one-liner: measures the raw processing power of hardware by performing floating-point operations per second
basic unit of compute
- GPT-3 (175B) ≈ 350 GFLOPs per token
operations on floating-point numbers (numbers with decimal points) include matrix multiplications, attention computations, activation functions
how is FLOP utilization rate roughly calculated?
% at which the hardware’s (CPU, GPU, TPU or any accelerator) max capacity is being actually used
example: if GPU peak capacity is 100 TFLOP/s (theoretical peak) under ideal conditions and inference only uses 40 TFLOP/s (achieved), then utilization rate is 40%
FLOP Utilization Rate = (Achieved FLOPS / Theoretical Peak FLOPS) × 100
how is “achieved” FLOPs potentially measured?
- thru a combination of profiling, analytical modeling and hardware performance counters
- profiling tools measures actual arithmetic throughput during kernel execution
- NVIDIA Nsight Systems: visualizes GPU kernel timelines, CPU activities, data transfers, etc
- NVIDIA Nsight Compute: provides low-level perf metrics of individual GPU kernels, such as
- arithmetic throughput ie actual floating-point operations per cycle/second (closest direct measurement)
- streaming multiprocessor (SM) ie time taken by compute units
- memory throughput ie data movement across memory levels
- other tools include AMD’s ROCm, Intel’s oneAPI
- exposes hardware counters (for modern GPUs) such as number of floating-point operations executed, memory accesses, cache hits/misses, etc
- analytical modeling involves estimating FLOPs for known operations, then dividing by the measured execution time
- a MatMul
M x K times K x N ~= 2 x M x K x NFLOPs - element-wise operations (Layer Norm, GeLU/ReLU) have fewer FLOPs
- a MatMul
- profiling tools measures actual arithmetic throughput during kernel execution
- note: achieved FLOPs is not directly observable in tools like
nvidia-smi
- thru a combination of profiling, analytical modeling and hardware performance counters
is it different from Model FLOPs Utilization (MFU)?
FLOP Utilization Rate: hardware-centric → how well your system uses available compute
MFU: model-centric → how efficiently your model uses hardware capacity
- in DeepMind’s PaLM, Chinchilla MFU is often computed during training
introduced in PaLM, it is the ratio between “actual” tokens processed-per-sec and “maximum” tokens system could process-per-sec if it ran at full capacity
MFU = ((Model FLOPs/tok × Tokens/s) / Peak Device FLOP/s) × 100typical MFU range
- 70%+ in llm workloads is rare and challenging
- 35-55% common for llm training and inference
- in practice, even with trillions of available FLOPs/sec, real-world usage might hit only 20–50%
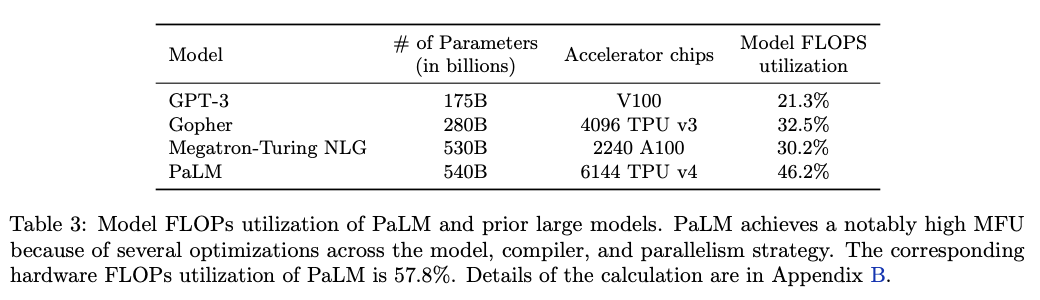 table source: https://arxiv.org/abs/2204.02311
how to interpret FLOP utilization rate?
- high utilization rate → faster training/inference and better throughput → more tokens generated per sec
- crucial for real-time applications like chatbots
- low utilization rate → hardware sits idle → system is not compute-bound; potential contributors:
- memory/bandwidth bottlenecks
- llms have billions of params that has to be loaded from memory into compute units for calculations
- when memory doesn’t supply data fast enough, compute units sit idle
- memory/bandwidth bottlenecks
- high utilization rate → faster training/inference and better throughput → more tokens generated per sec
why is the utilization rate often low?
- compute units wait on weights or KV-cache to be loaded → utilization drops
- autoregressive decoding is inherently sequential → limits parallelism
- inference is often done in small batches (vs large-batch training) i.e. often single-user request → underutilizes parallel hardware
- tangent: core problem of inference is being “memory bandwidth-bound”! lets briefly understand this infamous state of llm during inference
- to generate a single token, the model must perform a forward pass through its entire network (think all the params in all the layers)
- step 1: gpu must load the model’s parameters (weights) from its High Bandwidth Memory (HBM) into the on-chip SRAM of its processing cores
- step 2: then perform calculations (mostly matrix-vector multiplications) using these weights and send back the results
- for a “dense” model, almost all parameters are used for every single token generated that makes step 1 vastly slower (shuffling of data between memory and processors) than step 2 on modern hardware
- the processors are so fast they finish their calculations and are then left idle, waiting for the next batch of weights to arrive from HBM
- less parallelism means low FLOPs usage
- tangent: core problem of inference is being “memory bandwidth-bound”! lets briefly understand this infamous state of llm during inference
- load imbalance in sparse models or MoEs
how to get better utilization?
- batch requests during inference, e.g. for retireval or batched chatbot responses to utilize parallelism
- quantization (fp8, fp6, fp4 formats) reduces memory footprint and bandwidth pressure
- blackwell GPUs and other accelerators are optimized for these ultra-low precision formats
- fusing multiple ops (bias, activation, matmul) into a single kernel reduces memory reads/writes
- optimize async execution graphs (thru TensorRT, PyTorch, XLA) to overlap compute with memory fetch reduces stalls
- communication-aware strategies like Tensor Parallelism (TP), Pipeline Parallelism (PP), and Hybrid Parallelism are essential for scale — but only improve utilization if bandwidth and latency bottlenecks are also addressed
- that’s why improvements like NVLink, NVSwitch, InfiniBand, and optical interconnects are important — they enable distributed compute without starving GPUs of data
want to dive deep? suggested next readings:
- Making Deep Learning Go Brrrr From First Principles by Horace He
- Transformer FLOPs by Adam Casson